|
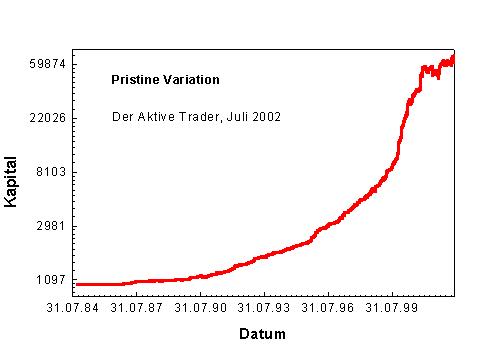
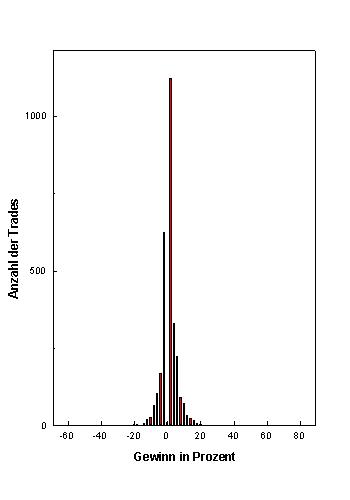
Ergebnisse Kapitalkurve Tradeverteilung
Getestete Titel:
3Com US$
Amazon.com US$
Amgen US$
Apple Computer US$
Applied Materials US$
Ariba US$
Atmel US$
Ballard Power Systems US$
BEA Systems US$
Biogen US$
Broadcom US$
BroadVision US$
Cephalon US$
Check Point Software US$
Chinadotcom US$
Chiron US$
Cisco Systems US$
Citrix Systems US$
CMGI US$
Commerce One US$
Conexant Systems US$
Dell Computer US$
DoubleClick US$
E*TRADE Group US$
E.piphany US$
Earthlink US$
eBay US$
Gemstar-TV Guide Int. US$
Genzyme General US$
Hemispherx Biopharma US$
Human Genome Science US$
i2 Technologies US$
IDEC Pharmaceuticals US$
IFCO Systems US$
Immunex US$
InfoSpace.com US$
Inktomi US$
Internet Capital Grou US$
Intuit US$
iVillage US$
JDS Uniphase US$
Juniper Networks US$
Level 3 US$
Medarex, Inc. US$
MedImmune, Inc. US$
MicroStrategy US$
Millennium Pharma US$
NetBank US$
Network Appliance, I US$
Nextel Communication US$
Novell, Inc. US$
Openwave Systems US$
Oracle Corporation US$
Palm US$
PeopleSoft, Incorpor US$
PMC-Sierra US$
priceline.com US$
Protein Design Labs, US$
Puma Technology Inc US$
Qualcomm US$
Rambus US$
Razorfish US$
RealNetworks US$
Red Hat US$
Siebel Systems, Inc. US$
Starbucks US$
Sun Microsystems US$
Sycamore Networks US$
Tellabs, Inc. US$
VA Linux Systems US$
Verisign US$
Veritas Software Cor US$
Vertex Pharmaceutica US$
VerticalNet US$
Wind River Systems, US$
Xilinx, Incorporated US$
Yahoo! Inc. US$
Adobe Systems TP US$
Akamai Technologies TP US$
Altera TP US$
Ergebnis im Optimierungszeitraum
System Start 01.01.88
System Ende 29.12.00
Anzahl aller Trades 27,1
Anzahl Trades/Jahr 5,6
Getestete Perioden 1549,4
Perioden mit Trades 2,2%
Netto-Profit 639,02
Buy/Hold-Profit 28.119,82
Profit-Ratio zu Buy/Hold- 2.748,08%
Profit/Periode-Ratio zu Buy/Hold 1,31%
Profitable Trades (%) 68,90%
Durchschn. Return 2,06%
Std.-Abw. aller Returns 5,26%
Portfolio-Faktor 36,84
Sharpe Ratio 0,39
Max. realisiertes Kapitalrisiko -10,90%
Ergebnis im Kontrollzeitraum
System Start 02.01.01
System Ende 01.07.02
Anzahl aller Trades 10,0
Anzahl Trades/Jahr 6,7
Getestete Perioden 372,1
Perioden mit Trades 2,7%
Netto-Profit 24,07
Buy/Hold-Profit -566,53
Profit-Ratio zu Buy/Hold 59,06%
Profit/Periode-Ratio zu Buy/Hold 0,46%
Profitable Trades (%) 55,78%
Durchschn. Return 0,27%
Std.-Abw. aller Returns 5,50%
Portfolio-Faktor 20,05
Sharpe Ratio -0,32
Max. realisiertes Kapitalrisiko -13,71%
|
|